
Exploratory Data Analysis and Hypothesis Testing
Automobile Insurance Claim Fraud Factors
Overview
This project used exploratory data analysis and statistical techniques in Python to prove or disprove a hypothesis based on automobile claims fraud variables.
Statistical Questions
- What variables in the auto insurance claim records show a distinction between fraudulent claims and non-fraudulent claims?
- Do the values of variables in observations in which fraud was reported differ statistically from the values of variables in observations in which no fraud was reported?
Hypotheses
- There is no difference in the means of variables in the fraud reported subset and the same variables in the fraud not reported subset.
- There is no significant linear relationship between the fraud reported target variable and any of the claim transaction variables.
Data
Techniques
- Histograms
- Descriptive statistics
- Probability mass function
- Cumulative distribution function
- Probability plot
- Scatter plots
- Point-Serial Correlation
- Permutation tests
Distinctive Variables
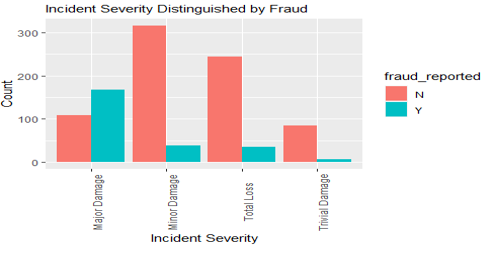
Incident Severity
68% of fraud reported cases claimed Major Damage but only 14% of fraud not reported cases claimed Major Damage.
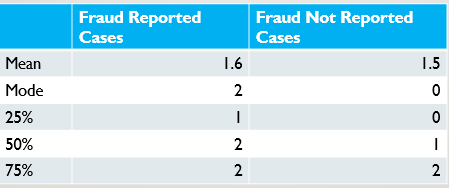
Witnesses
Fraud reported cases have higher means and quartiles for number of witnesses at every checkpoint.
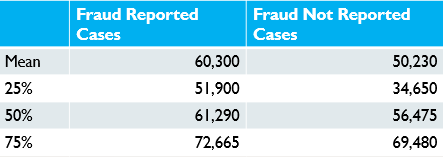
Total Claim Amount
Fraud reported cases have higher means and quartiles for total claim amounts at every checkpoint.
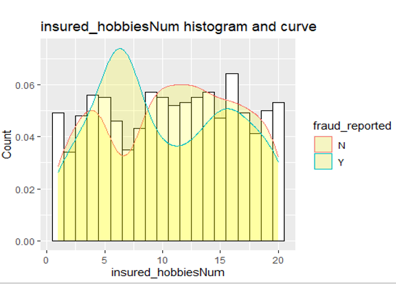
Hobbies
The claimant’s hobbies show some variation in fraud cases.
Umbrella Limit
The p-value from point-biserial correlation indicates that the umbrella limit variable may be significant.
Outcome
Through statistical analysis and hypothesis testing, I rejected the null hypothesis that there is no difference in the means of Total Claim Amount variable in the fraud reported subset versus the fraud not reported subset, but concluded that it is plausible that the observed difference in means between the other variables in the fraud reported subset and the fraud not reported subset are just the result of random sampling and rejected the null hypothesis for all variables other than the Total Claim Amount variable.
Regarding the hypothesis that there is no significant linear relationship between the fraud reported target variable and any one of the claim transaction variables, the correlation hypotheses testing showed that the null hypothesis should be accepted as none of the p-values of the claim transactions variables were statistically significant.
Resources
This analysis utilizes supported code from Allen Downey’s ThinkStats2 ThinkStats2